
Ally: Torne seu site mais inclusivo, examinando as violações de acessibilidade, corrigindo-as facilmente e adicionando um widget de usabilidade e estatísticas de acessibilidade …
Debug Log Manager Tool
Hospedagem WordPress com plugin Debug Log – Manger Tool
Onde posso hospedar o plugin Debug Log – Manger Tool?
Este plugin pode ser hospedado em qualquer servidor que possua WordPress configurado. Recomendamos fortemente utilizar uma hospedagem confiável, com servidores otimizados para WordPress, como o serviço de hospedagem WordPress da MCO2.
Hospedando o plugin Debug Log – Manger Tool em uma empresa de hospedagem seguro
A MCO2, além de instalar o WordPress na versão mais atualizada para seus clientes, disponibiliza o WP SafePress, um mecanismo exclusivo que assegura e otimiza seu site ao mesmo tempo.
Por que a Hospedagem WordPress funciona melhor na MCO2?
A Hospedagem WordPress funciona melhor pois a MCO2 possui servidores otimizados para WordPress. A instalação de WordPress é diferente de uma instalação trivial, pois habilita imediatamente recursos como otimização de imagens e fotos, proteção da página de login, bloqueio de atividades maliciosas diretamente no firewall, cache avançado e HTTPS ativado por padrão. São recursos que potencializam seu WordPress para a máxima segurança e o máximo desempenho.
A comprehensive debugging toolkit for WordPress developers, agencies, and site administrators. This plugin gives you control over WordPress debugging without editing wp-config.php files or using FTP.
Quick Demo
Key Features
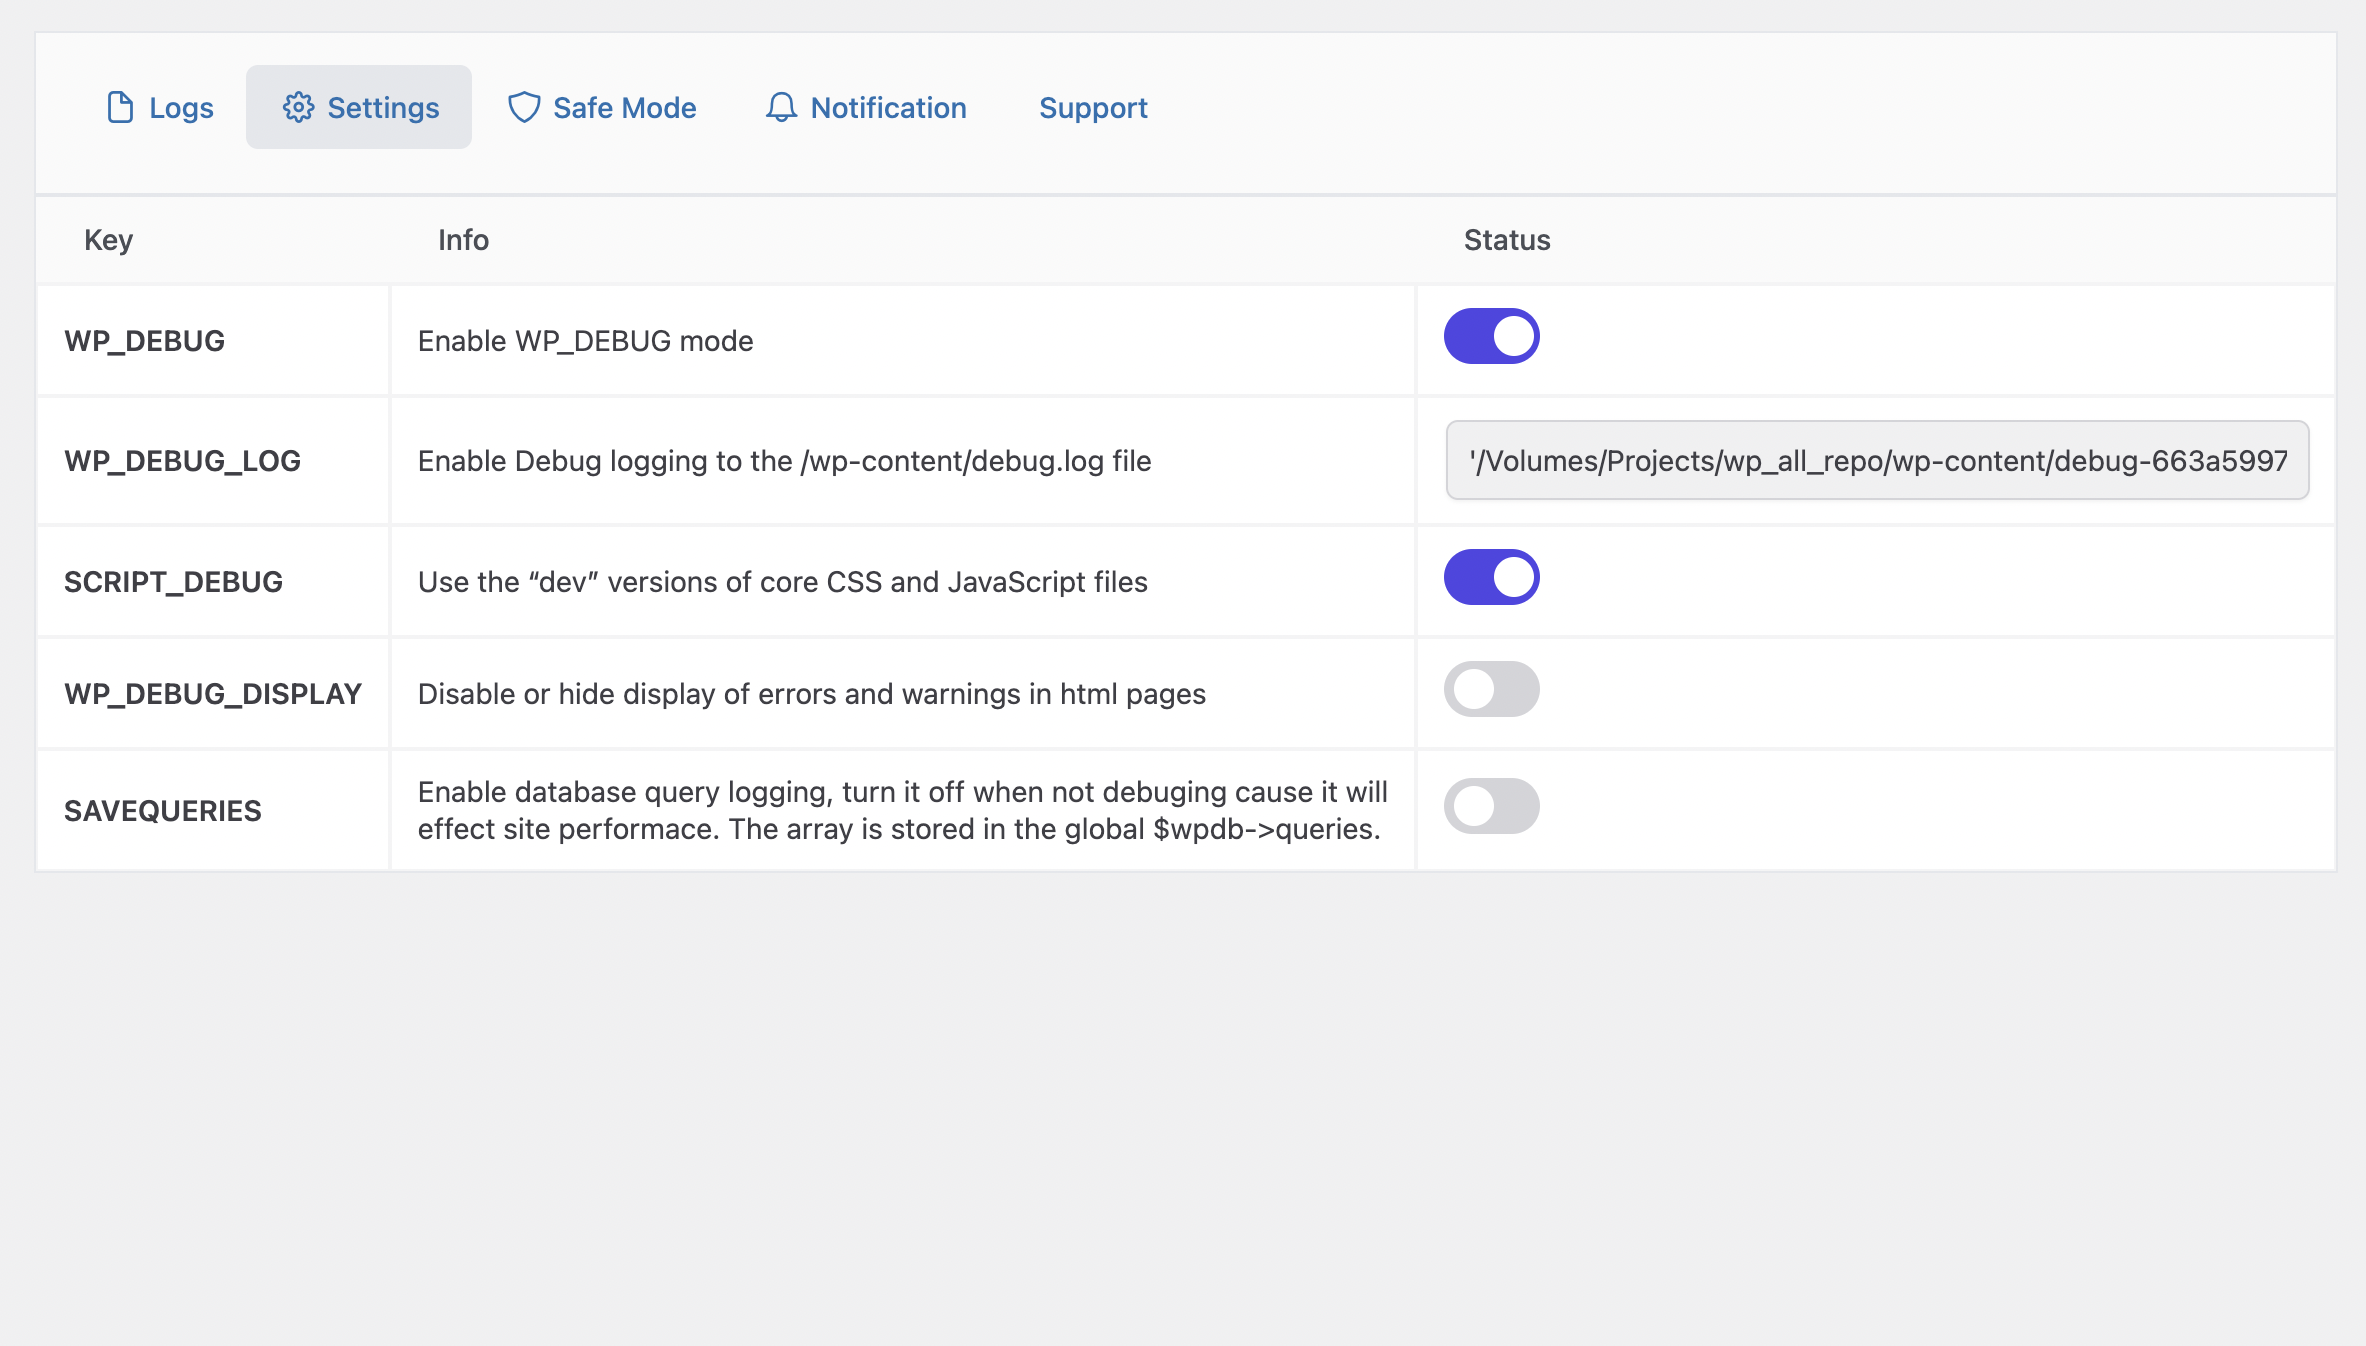
- Debug Constants Manager: Toggle WP_DEBUG, WP_DEBUG_LOG, WP_DEBUG_DISPLAY, SCRIPT_DEBUG, and SAVEQUERIES without manually editing wp-config.php.
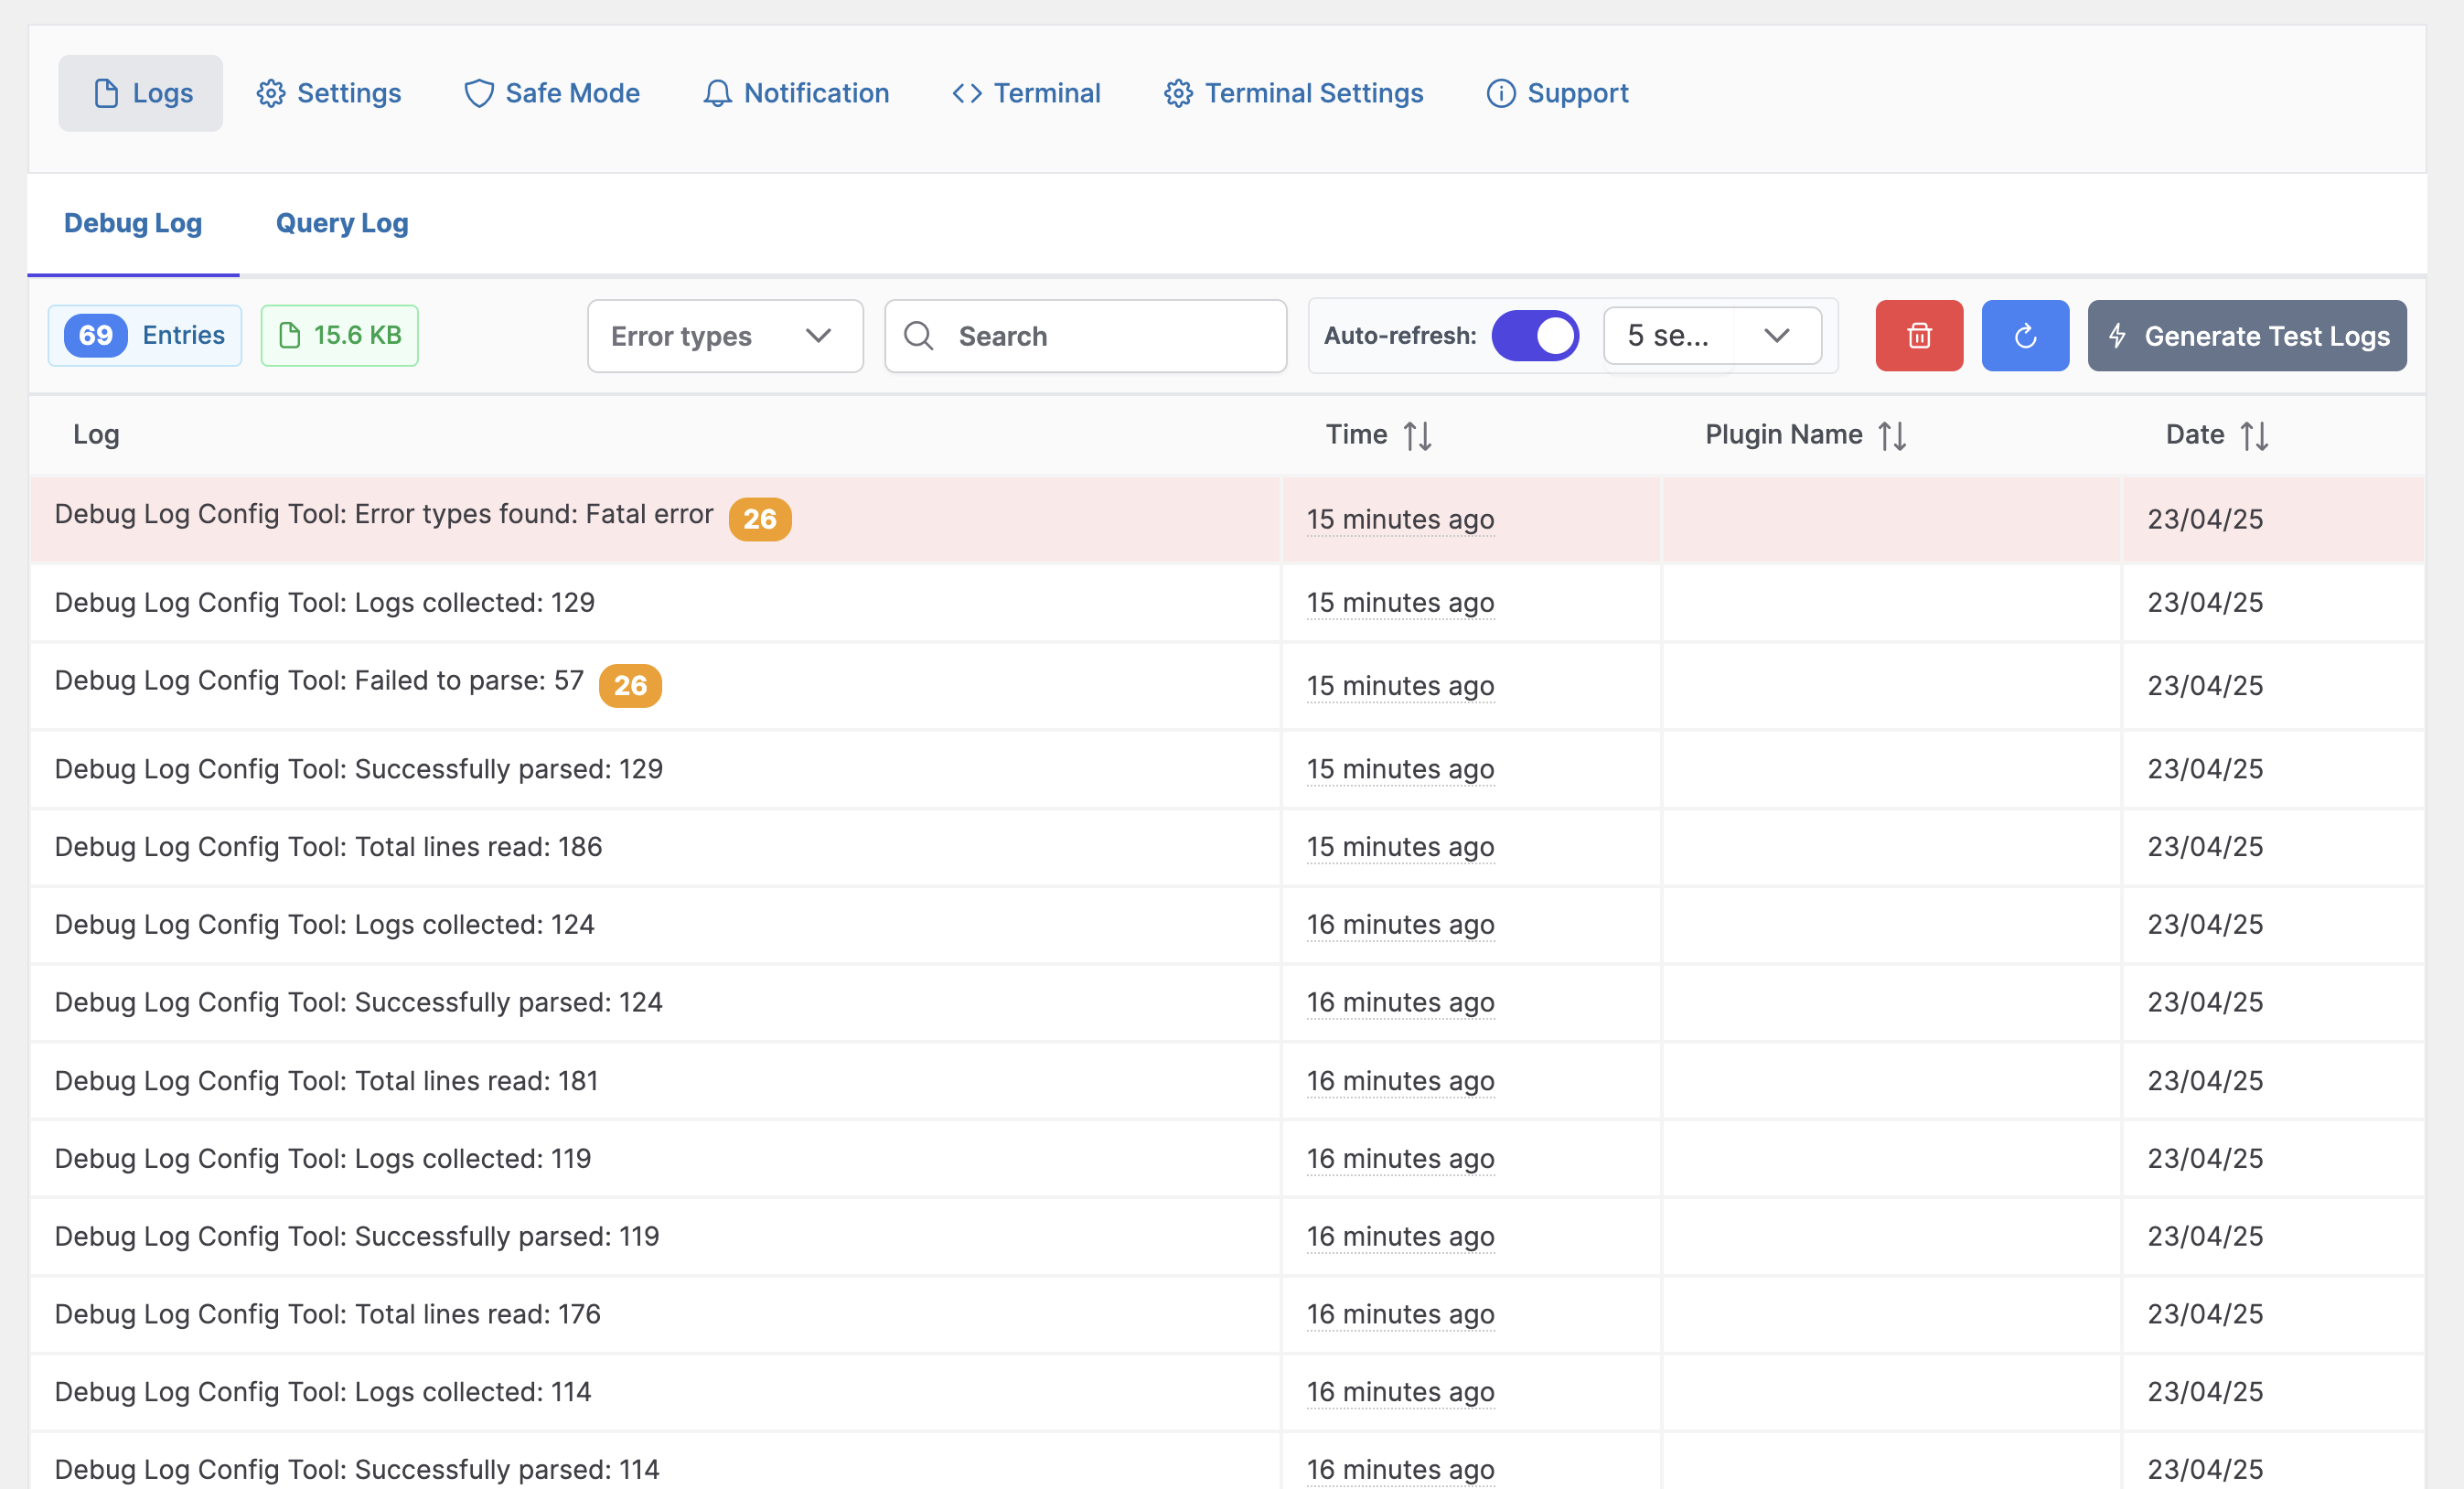
- Modern Debug Log Viewer: View, search, filter, group, and clear debug log entries from a compact WordPress admin interface.
- Readable Timeline Rows: Scan log entries with severity labels, occurrence counts, plugin/source hints, exact timestamps, and copy-as-JSON actions.
- Stack Trace Analysis: Format PHP stack traces and database call chains so long fatal errors are easier to read.
- Large Log File Preview: Open the current debug log file inside a modal and safely read the latest 1 MB of large files.
- Query Inspector: Examine database queries when SAVEQUERIES is enabled, including SQL, caller, execution time, and stack trace details.
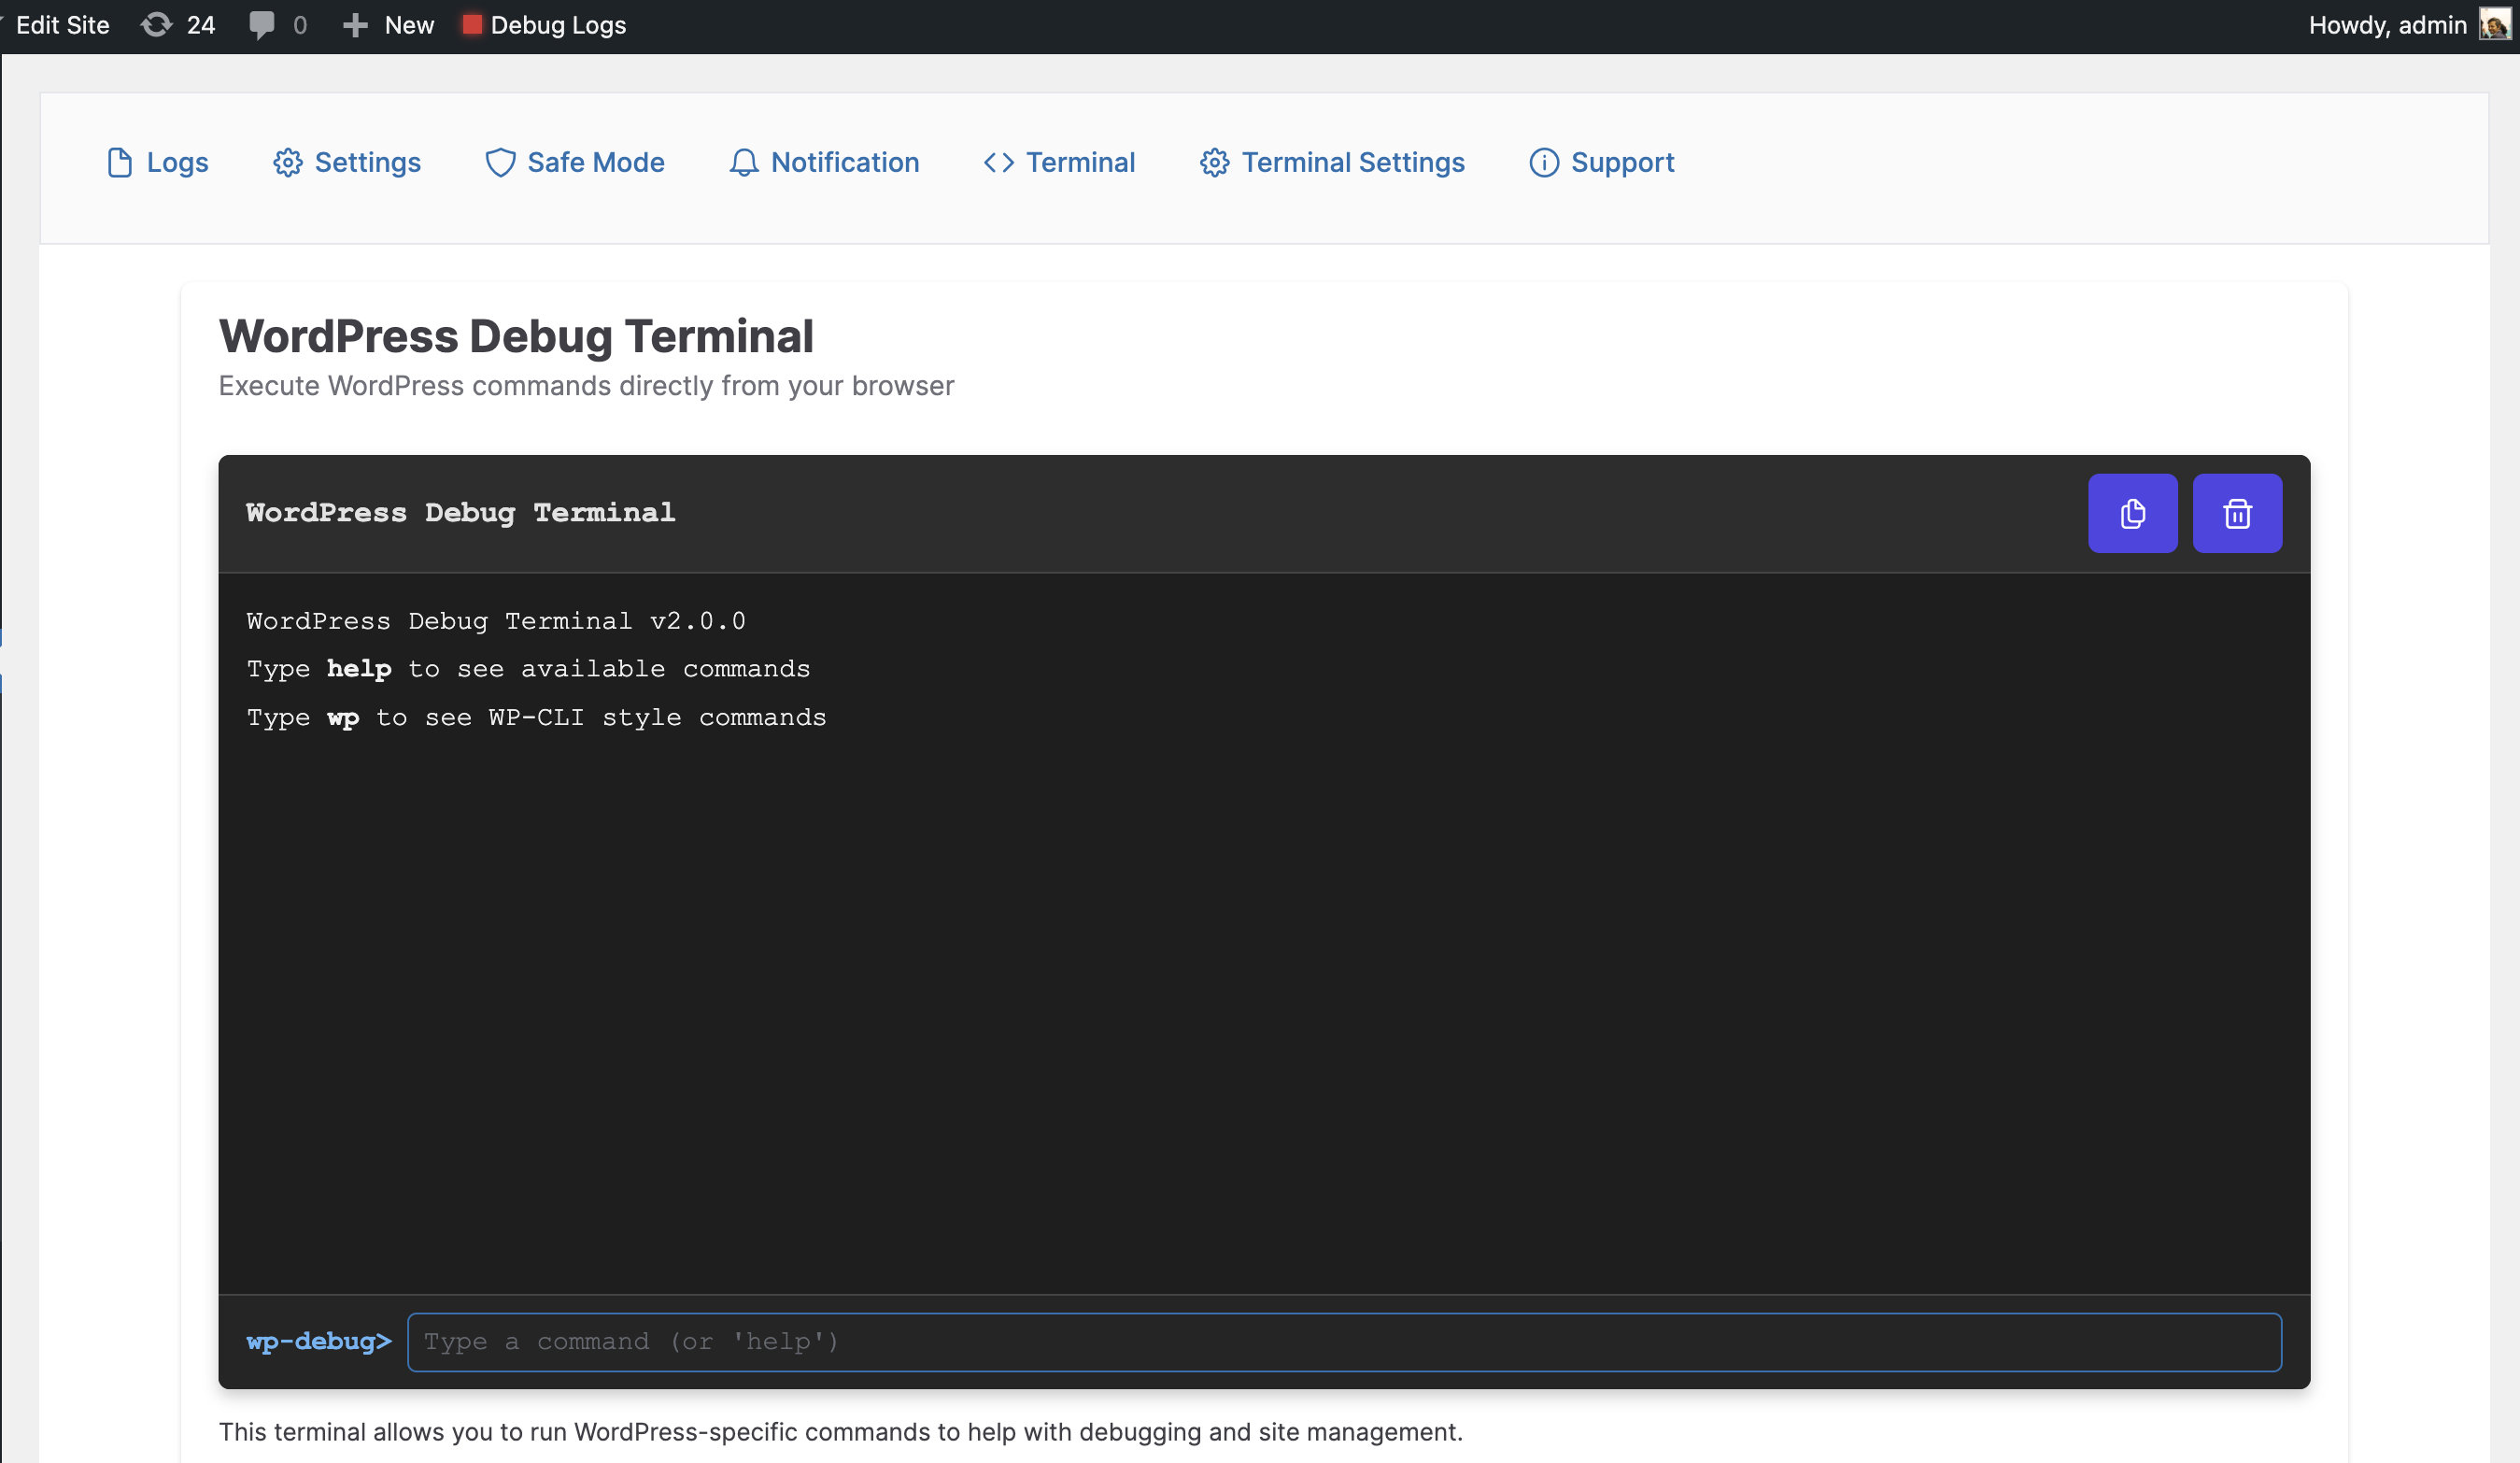
- WP-CLI Style Terminal: Run guarded WordPress-style commands directly from the browser with command history and auto-completion.
- Terminal Settings: Enable or disable terminal access and database commands from a dedicated settings screen.
- Safe Mode: Temporarily isolate plugin conflicts by keeping selected plugins active and restoring the previous state when Safe Mode is turned off.
- Email Notifications: Configure notification email settings, daily summaries, and test email delivery for debug activity.
- Admin Bar Debug Toggle: Quickly enable or disable WP_DEBUG from the WordPress admin bar.
- Dashboard Widget: See recent debug log activity from the WordPress dashboard.
- Custom Log Path Support: Use filters to customize the debug log location.
- Hardened Admin Routes: AJAX actions use nonce and capability checks, with guarded file path handling for debug log access.
Debug Constants Available
- WP_DEBUG – Default Value: true – Enables WordPress debug mode
- WP_DEBUG_LOG – Default Value: true – Saves all errors to a debug.log file
- SCRIPT_DEBUG – Default Value: false – Uses development versions of core JS and CSS files
- WP_DEBUG_DISPLAY – Default Value: false – Controls whether debug messages display on screen
- SAVEQUERIES – Default Value: false – Saves database queries for analysis
Developer Tools
- Terminal Commands: Use WP-CLI style commands like
wp core versionorwp plugin list - Database Explorer: Run SELECT queries and view results in a formatted table
- Stack Trace Analysis: Visualize error stack traces for easier debugging
- Hook Inspector: View all registered hooks and their callbacks
- Environment Detection: Development features are automatically hidden in production
- Copy JSON: Copy structured log entries for support tickets or developer handoff
- File Viewer: Inspect the debug log file without leaving the WordPress admin screen
Developer API: Apply custom filters like
apply_filters('wp_debuglog_log_file_path', $file);to extend functionality
Please note: Constant values will be restored on plugin deactivation as it was before activating the plugin.
Capturas de tela
Debug log timeline with filters, grouped events, and file tools
Terminal and database debugging commands
Safe Mode and settings screens
Plugins semelhantes
WP Crontrol enables you to take control of the cron events on your WordPress website.
Duplicação de posts, ordenação dos posts, redimensionamento de imagens, e-mail através de SMTP, editor do menu administrativo, CSS/código personalizado, desativação do Gutenberg e muito mais em um único plugin.
O Query Monitor é um painel de ferramentas do desenvolvedor para WordPress e WooCommerce.
Change the domain on your site with one click.
A powerful way to update your WooCommerce product catalog. Finally, no more tedious clicking through countless pages!